The US Dollar to Japanese Yen (USD/JPY) exchange rate is a Forex major pair and one of the world’s most traded currency pairings.
In this article we make a US-Dollar / Japanese Yen forecast and long term price prediction. We would like to give an assessment of the future price development of USD/JPY forex pair. We look at the short term chart like the daily chart, the medium term chart like the weekly chart and monthly charts, and also the long term charts for USD/JPY which are the quarterly and yearly charts. The basis of our analysis is the Price Action and Technical Chart Analysis.
The charts used are from TradingView and the prices are from FXCM.
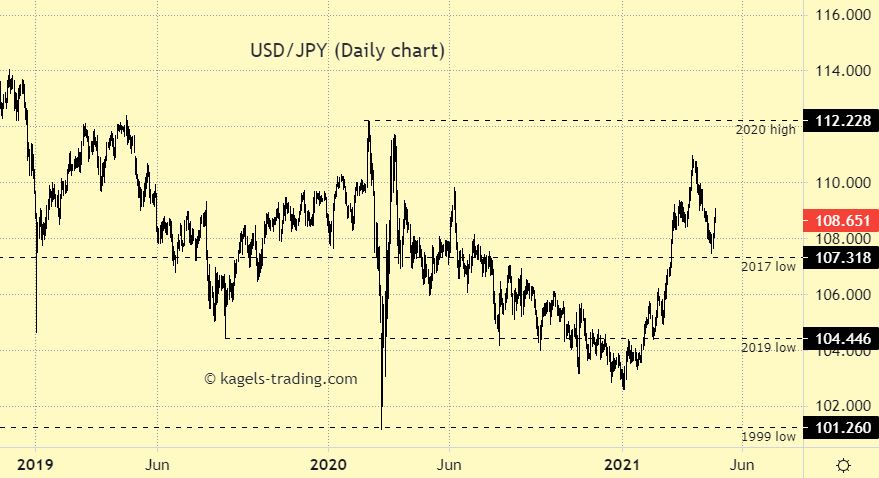
USD/JPY Forecast Daily Chart
Last Update: April 28, 2021
On the daily chart of the USD/JPY currency pair, we see this major forex pair in an established downtrend with a temporary recovery above the 2017 low.

Resistance: 112.22
Support: 107.31 | 104.44 | 101.26
USD/JPY forecast: The price advance above the 2017 low at 107.32 may lead to more upwards action. The range from 2020 marks a huge sideways frame.
USD/JPY Outlook Weekly Chart
Last Update: April 28, 2021
On the weekly chart of the USD/JPY currency pair, we see this major forex pair recovering above the 2017 low levels.

Resistance: 112.22
Support: 107.31 | 104.44 | 101.26
USD/JPY forecast: With the rise above the 2017 low could form further upward momentum. The price range from 2020 marks a wide zone for sideways movement. A rise above the 2020 high would turn the neutral outlook to positive.
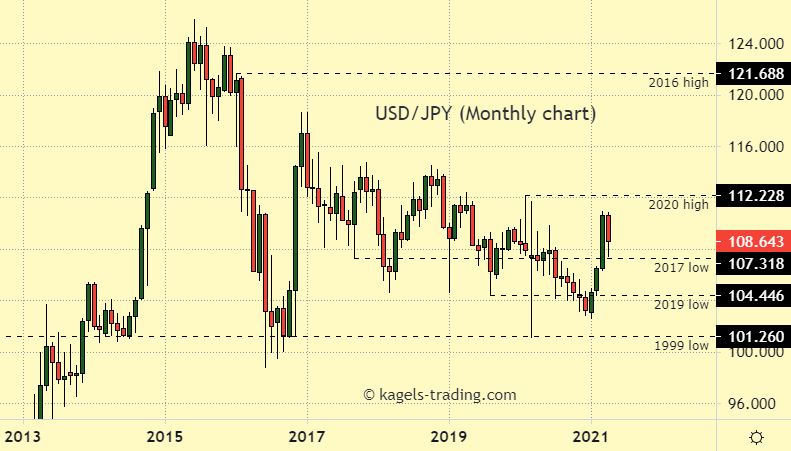
USD/JPY Forecast Monthly Chart
Last Update: April 28, 2021
On the monthly chart of the USD/JPY currency pair, we see this major forex pair moving in an defined downtrend. The price zone between the low of the year 1999 at 101.26 and the low of 2016 at 98.78 is long-term key support.

Resistance: 112.22
Support: 107.31 | 104.44 | 101.26
USD/JPY forecast: The price advance above the 2017 low at 107.31 has created a neutral with possible positive outlook for the monthly chart picture. The high from 2020 could be the next target.
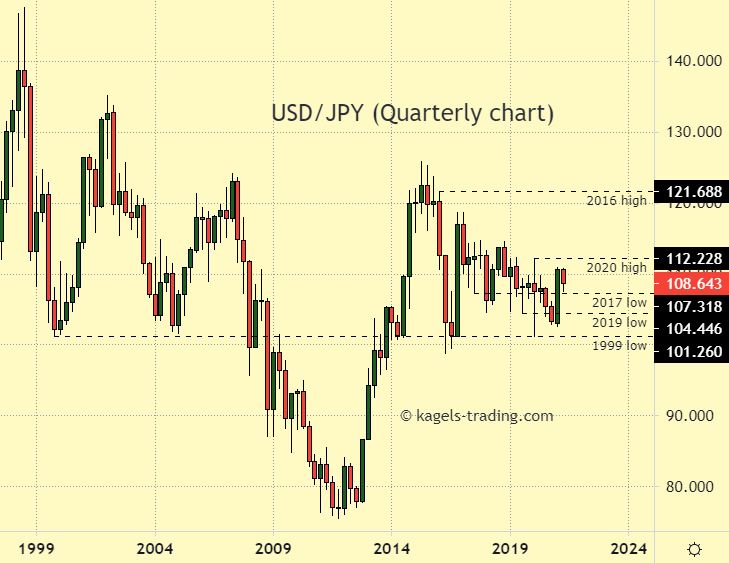
USD/JPY Forecast Quarterly Chart
Last Update: April 28, 2021
If we look at the quarterly chart of the USD/JPY currency pair, we see this major forex pair moving sideways in a big trading range between the 2016 high at 121.68 and the 2016 low at 98.78. The quarterly volatility is shrinking and the price direction of USD/JPY shows a series of lower highs. The low of the year 1999 is major support and also the low of 2016.

Resistance: 112.22 | 121.68
Support: 107.31 | 104.44 | 101.26
US-Dollar/Japanese Yen prediction: We are now expecting some kind of struggle between the 1999 low and 2020 high. Only a price advance above the 2020 high could turn this long term chart positive. The strong support at the price zone of 101.26/98.78 may prevent stronger weakness.
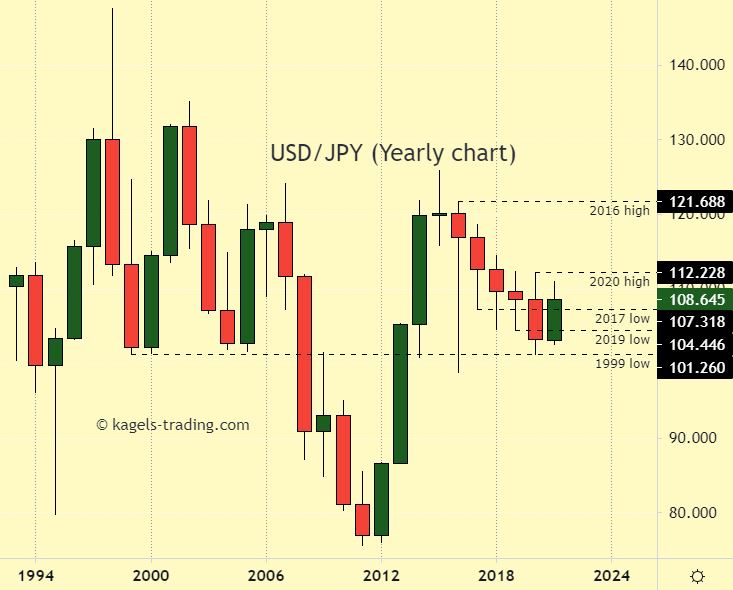
USD/JPY Forecast Yearly Chart (Historical chart)
Last Update: April 28, 2021
If we look at the yearly chart of the USD/JPY currency pair, we see this major forex pair moving sideways in a big trading range between the 2016 high at 121.68 and the 2016 low at 98.78. The low of the year 1999 at 101.26 is major support.

Resistance: 112.22 | 121.68
Support: 107.31 | 104.44 | 101.26
US-Dollar/Japanese Yen forecast: We are now expecting some kind of struggle between the 1999 low and 2020 high. Only a price advance above the 2020 high could turn this long term chart positive. The strong support at the price zone of 101.26/98.78 could prevent strong weakness.
What is the current price of USD/JPY ?
The current price of USD/JPY you can see here.
About USD/JPY
The Currency Pair USD/JPY is the shortened term for the US-Dollar against Japanese Yen, or cross for the currencies of the United States (USD) and Japan (JPY). … For example, if the pair is trading at 110.50, it means it takes 110.50 Japanese Yen to buy 1 US-Dollar.
*This price prediction is based on the data collected from various sources. This should not be considered as an investing parameter and user should do their own research before investing.
Do you think our predictions are accurate? What are your thoughts on the methods used to reach our conclusions? Let us know in the comments below.